
The Relationship Between Color Rendering Index (CRI) and Luminous Flux in Optics
1. Basic Definitions
Luminous Flux (Φ, Unit: Lumen, lm)
Luminous flux refers to the total amount of visible light energy radiated by a light source per unit time, weighted by the human eye’s spectral sensitivity function \(V(\lambda)\). It directly reflects the brightness output of a light source and is a core indicator for evaluating lighting efficiency.
Color Rendering Index (CRI, (Ra), Range: 0–100)
CRI quantifies a light source’s ability to reproduce the true colors of objects compared to a reference light source (blackbody radiator or daylight). A higher CRI means more natural, realistic color performance; a low CRI causes color distortion (e.g., red objects appearing dark or faded).
2. Spectral Principle: The Fundamental Link Between CRI and Luminous Flux
The connection between CRI and luminous flux is entirely determined by the spectral power distribution (SPD) of the light source, as shown in the spectral diagram.
Key Mechanism
- Luminous flux depends only on the light intensity within the visible band (380–780 nm) weighted by human eye sensitivity (peak at 555 nm green-yellow light).
- CRI depends on the spectral completeness across the entire visible band, especially the red (600–700 nm) and blue (420–480 nm) components.
Typical Spectral Comparison
Trade-off: Part of the energy is allocated to low-sensitivity bands (especially deep red) → reduced total luminous flux under the same input power.
1. High luminous flux, low CRI (e.g., cool white LED, (Ra < 80))
- Spectrum: Strong green-yellow peak, weak red and blue components.
- Feature: Concentrates energy in high-sensitivity bands → high luminous efficiency → high luminous flux.
- Problem: Missing spectral segments → poor color rendering.
2. High CRI, relatively lower flux (e.g., full-spectrum LED, (Ra > 90\))
- Spectrum: Continuous and balanced across red, green, blue, and deep red bands.
- Feature: Completes the spectrum to improve color reproduction.
- Trade-off: Part of the energy is allocated to low-sensitivity bands (especially deep red) → reduced total luminous flux under the same input power.
3.Quantitative Relationship: The Inherent Trade‑Off
Under equal input electrical power and chip efficiency:
CRI↑⟹Luminous Flux↓
Typical Data Comparison
| Light Source Type | CRI (Ra) | Luminous Flux Level | Spectral Characteristic |
| Conventional LED | 70–80 | High | Narrow blue excitation + broad yellow phosphor |
| High-CRI LED | 90–97 | 5–15% lower | Added red phosphor / multi‑peak full spectrum |
| Incandescent Lamp | 95–100 | Very low | Continuous blackbody spectrum |
Physical Explanation
To raise CRI, manufacturers must add red phosphors or multi‑color chips to supplement missing wavelengths. These components have lower photoelectric conversion efficiency and reduce the proportion of high-efficiency green-yellow light, directly lowering total luminous flux.
4. Visual Explanation with Spectral Diagrams
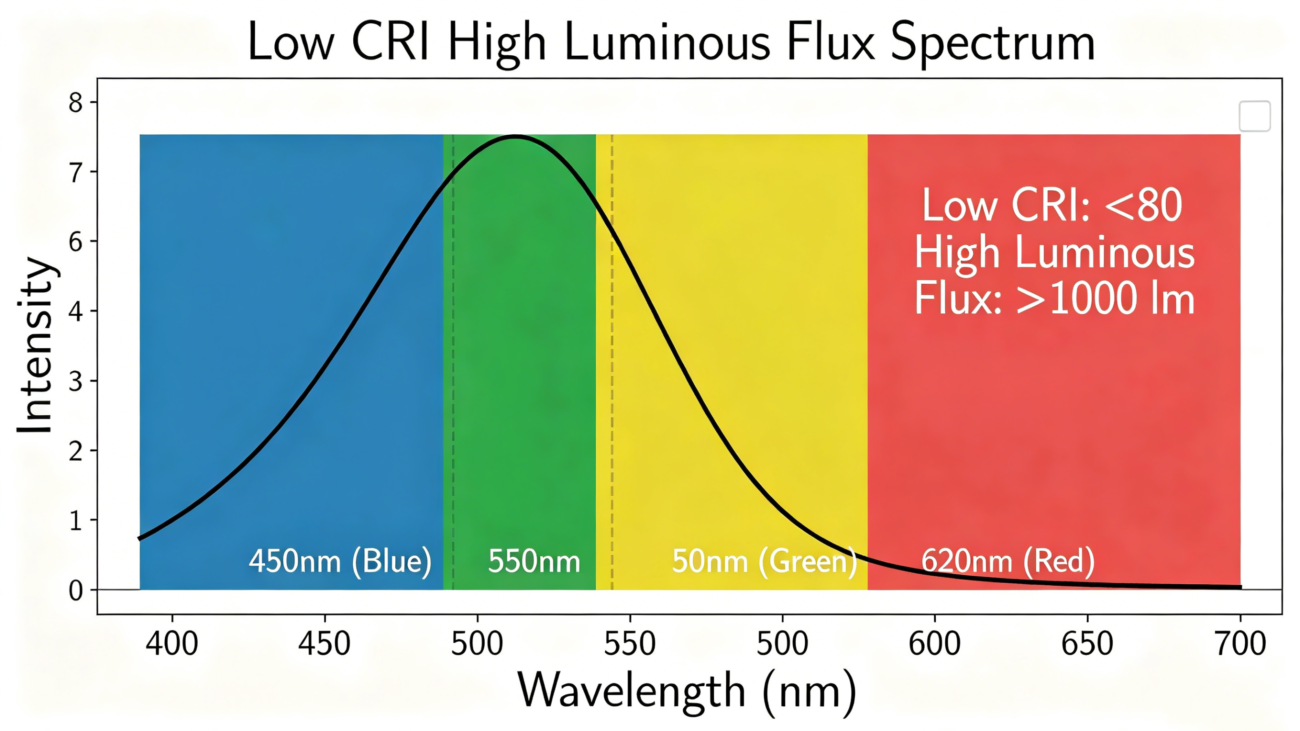
Diagram A: Low-CRI, High-Flux Spectrum
- Sharp peak in green-yellow region.
- Almost no deep-red component.
- High luminous flux, but red objects appear dull.
Diagram B: High-CRI, Moderate-Flux Spectrum
- Gentle, continuous curve across visible spectrum.
- Obvious enhancement in red band.
- Slightly lower total area under the curve (lower flux), but colors are vivid and realistic.
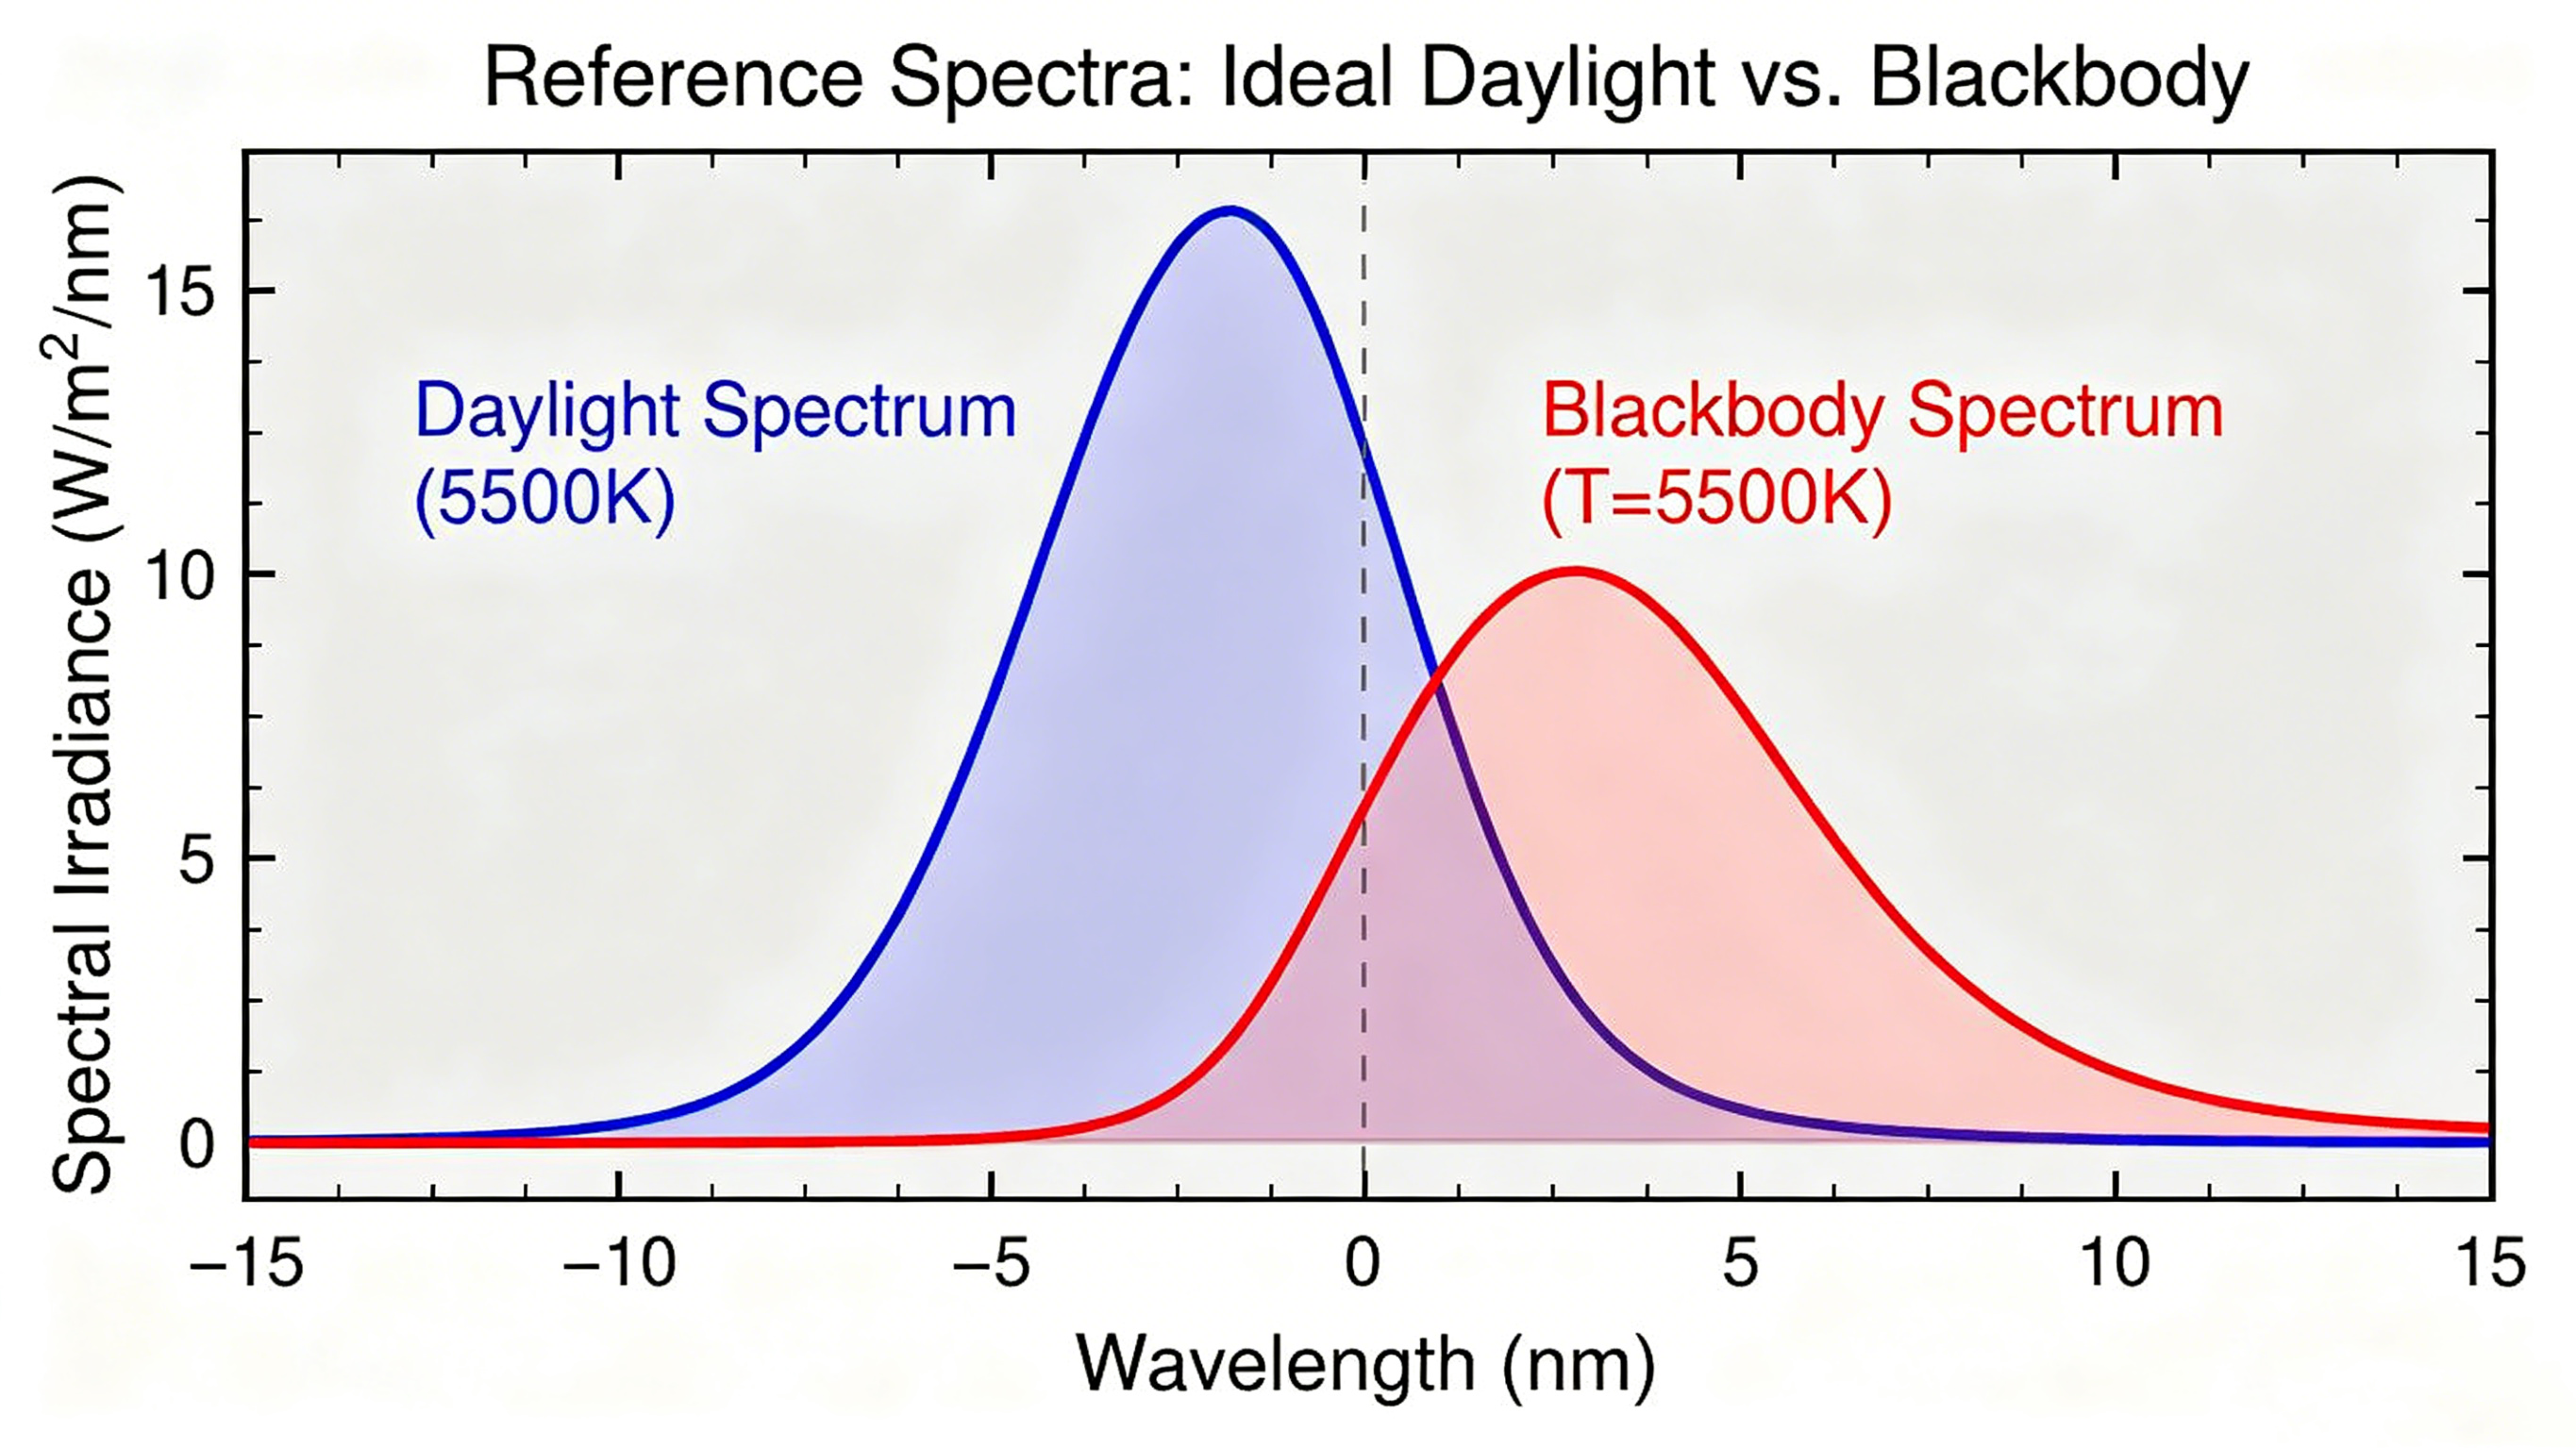
Diagram C: Ideal Reference (Daylight / Blackbody)
- Ultra-smooth continuous spectrum.
- CRI ≈ 100, but extremely low luminous efficiency.
5. Summary of Essential Relationship
- No direct linear correlation, but a clear efficiency trade-off determined by spectrum.
- Luminous flux reflects brightness output; CRI reflects color quality.
- High CRI requires a full, balanced spectrum, which inevitably sacrifices some luminous efficiency.
- Modern high-performance full-spectrum LEDs narrow the gap, achieving (Ra > 95\) with only a small flux loss.

This is a great tip particularly to those new to the
blogosphere. Simple but very accurate info… Many thanks for sharing this one.
A must read post!
Thank you for your comment. We try to share more knowledge about optical convenience so that more friends can learn and understand it, in order to better understand optics and serve our lives in the future. If you have any good ideas, you are welcome to share them with us.